
From Technical to Business-Focused Monitoring in Data Integration
“Can you tell me whether the integration is running? I don’t see my data.”
A question that every integration developer has certainly heard more than once. We will take this as an opportunity to explore the topic of monitoring in data integration.

Goal
This article is not only about technical monitoring, as it is already common practice in many IT departments, but also about the need for business users to gain insights into monitoring themselves. This is exactly where there is significant potential for companies to optimize processes and increase employee satisfaction. I primarily want to provide integration architects, but also developers and monitoring teams, with ideas on how monitoring can be taken a step further.
Classic Monitoring
Monitoring in IT has a long tradition. Who doesn’t know them—log files that contain more or less useful information. And they often have one thing in common: they are difficult to read.
Modern monitoring therefore tries to collect log files—wherever they may be generated—and make them usable, and only then do error chains become visible. For example: the firewall has recently started blocking traffic, which causes the connector to throw a timeout, so the data never arrives at the target system.
Without centralized monitoring, one would eventually identify the problem—but with significantly more personal and time-related effort. Today, monitoring no longer consists solely of collecting logs, but also of gathering metrics and traces to obtain a holistic view of the state of the IT infrastructure. Let’s take a brief look at these components from an IT perspective.
Logging / Log Management
Logging deals with writing log files containing technical and business-related information; log management deals with collecting, processing, and analyzing them. Processing is a crucial part, because logs are usually very individual and often contain a large amount of information. While this information is important for detailed root-cause analysis, it is not necessarily suitable for technical monitoring. Without filtering and structuring, one may fail to see the forest for the trees, or make it difficult—if not impossible—to identify correlations.
Metrics
Metrics are key figures such as CPU utilization, memory consumption, disk usage, and so on. They are important for assessing whether the infrastructure is functioning properly and is correctly dimensioned. Metrics help to identify and prevent bottlenecks, but also to optimize costs. A server that runs at an average utilization of 10% is a bad server—at least from a controller’s point of view 🙂.
Tracing
Tracing shows temporal relationships between activities, even across multiple integration processes. This allows the path of a request through various APIs and applications to be tracked. Technical call chains become visible, along with the time spent in each step.
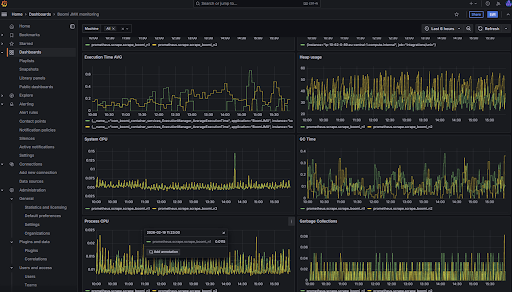
Dashboards
Dashboards are graphical visualizations of collected monitoring data that allow us humans to quickly grasp important information visually. We immediately recognize a “red light” and can interpret it, unlike text that first has to be read. I mention dashboards here because they can become the central tool for business users to keep an eye on their processes without having to ask IT.
Monitoring Reimagined
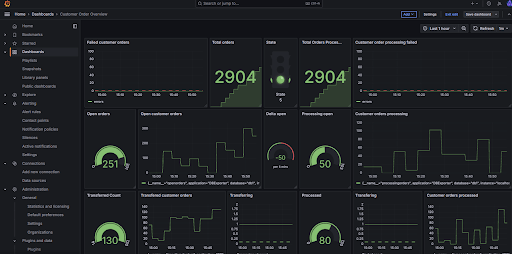
So how do we get from “Can you tell me whether the integration is running?” to “I know there are issues right now and I’m not left in the dark”? The answer lies in dashboards—deliberately dashboards in the plural, because depending on the business area and the process, these dashboards can look very different.
To arrive at such business-focused dashboards, stakeholders should look at each process that needs to be monitored from a business perspective. What does it include? Which integrations are involved? What are good indicators that show whether the process is running smoothly? How can problems be detected, and at which thresholds should alerts be triggered? Asking these kinds of questions provides valuable insight into what is actually happening from a business point of view. And a dashboard only becomes business-focused if it shows the right business metrics and information.
The next step is to translate the business requirements into a technical foundation. For example, the number of incoming orders might turn into something like `select count(*) from orders where status=’new’`. Or “problem X” might be reflected in a log file with the text “something strange happened.” The duration from packing a parcel to printing the delivery note might lead to more detailed tracing, or questions about data freshness may require identifying the correct timestamp. In some cases, the integration itself will need to be adapted so that it actually provides the required business information.
When such dashboards are built, business users are given a valuable tool that enables them to stay informed and act independently—especially if they can directly analyze and resolve business-related issues (“wrong posting period,” “name too long,” etc.). This, in turn, relieves IT support staff on the one hand, and integration developers in particular on the other. They are usually the first to be contacted and then spend their time analyzing problems instead of working on (further) development. This increases satisfaction for everyone involved.
With these new capabilities, additional analyses also become possible. With good correlation attributes in place, entire process chains can be monitored. Tracing is no longer purely technical (which functions were called and how long each took), but business-oriented: How long did the entire order process take, including shipping, invoicing, and so on? This provides valuable insights into operational processes and may reveal further optimization potential. This will not only make controllers happy, but ultimately also customers, who benefit from an even better experience than before.
Tools
The good news is that no new tools are required. All logs and metrics generated by integration platforms, whether cloud based or not, such as Boomi, OIC, or MuleSoft can be ingested into existing monitoring tools via standard ingestion agents and built-in scraping mechanisms provided by the monitoring platforms. This makes it easy to build a business view on top of them. You may only need to add some additional logging or business-specific metrics. Tools like Grafana or the Elastic Stack already provide everything business users need, and most companies already have a suitable tech stack in place.
What matters is not what the stack is called, but that it is actually used. In several conversations, I have heard concerns about giving business users access to this stack. I consider these concerns unfounded, because what they really need is access to dashboards. Modern platforms offer fine-grained permission management, making it possible to create clearly separated dashboards and provide them only to users who can actually benefit from them or are authorized to see specific information.
Costs
Of course, developing dashboards initially involves costs. However, these are usually not very high if a pragmatic, iterative approach is taken. The “golden metric” can always come later. Most of the information required for business dashboards is already captured by monitoring systems—the treasure often just hasn’t been uncovered yet. What you get in return is greater efficiency and higher employee satisfaction. Efficiency gains can be more easily translated into monetary figures than the softer factor of “satisfaction.” However, this should by no means be underestimated, because satisfied colleagues also collaborate better and faster.
Conclusion
Anyone who is willing to extend monitoring in data integration toward business-focused monitoring gains on multiple levels: the level of knowledge, productivity, and—perhaps most importantly—the emotional level. Developers are relieved, and satisfaction among business users increases. Back to the beginning: “Everything is running smoothly today.” Your system too?