Implementing As-of-Date and Combining Two Data Slicers in Power BI
In a recently concluded project involving migration of Oracle Business Intelligence Enterprise Edition (OBIEE) reports to Power BI, the Apps Associates team faced the challenge of dynamically selecting dates through a slicer. OBIEE has functionality which can dynamically display or show dates, whereas Power BI does not have this feature readily available. This blog will describe the way to achieve dynamic as-of date feature in Power BI as well displaying data for two separate date columns.

By selecting a date option using slicer, it should automatically display the information when we click on dates’ slicer. All data as of the selected date will be dynamically displayed.
Complexity of the Scenario:
In Power Bi, when we try to select a date option, it usually gives us options like below
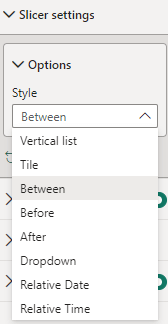
Each of these options display the dates in a different way but none of these meet our requirements and we do not have option to make the dates work dynamically.
To make it work, we need to create two different date tables with the following options.
- Table 1: As of Date 1
Dax function to create table: Created as per the example dataset
As of Date 1 = CALENDAR(DATE(2010,1,1), TODAY()) - Table 2: As of Date 2
As of Date 2 = CALENDAR(DATE(2010,1,1), TODAY()) - In-order to filter the data by selecting dates, we need to create a calculated column in
As of Date 1 table as below:
date filter as of date 1 = LASTDATE(‘As of Date 1′[Date]) - Like-wise we need to create a calculated column in As of Date 2 Table and as follows:
date filter as of date 2 = LASTDATE(‘As of Date 2′[Date])
After creating the above date tables, we need to establish a relationship with the Fact table. It is ideal to create a date table separately with Day, Month, Month number, Quarter, Year.
In modelling, we need to give the in-active relationship from the two date tables to Fact table as shown below.
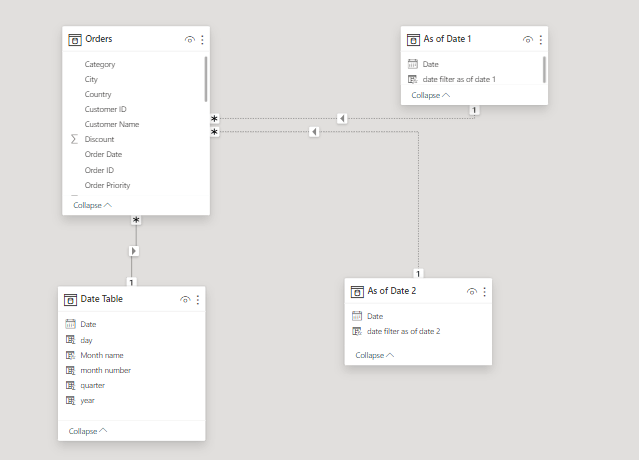
Usually, we can get information directly with an Active relationship. However, between two tables there can only be one Active relationship.
If we want to join more columns between these two specific tables, there should be an in-active relationships and cardinality is one to many (1—–*) from As of Date 1 and As of Date 2 to Orders as shown in the above figure.
Our primary intention is to show the business metrics like Sales, Profit, Discount, etc. dynamically based on date selection e.g. the normal way we show data by taking a date slicer with “between” option is as follows
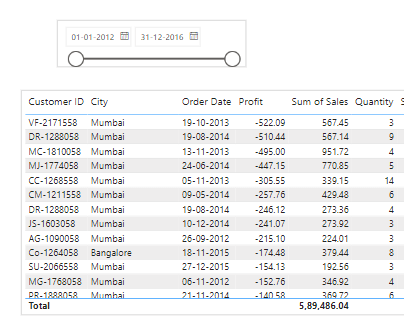
Now to display data using both As of Date 1 and As of Date 2, we create measures using both dates as below:
| Profit as of date 1 = | CALCULATE(SUM(Orders[Profit]), USERELATIONSHIP (Orders [Order Date], (‘As of Date 1′[Date]))) +0 |
| Profit as of date 2 = | CALCULATE(SUM(Orders[Profit]), USERELATIONSHIP (Orders [Order Date], (‘As of Date 2′[Date]))) +0 |
| Sales as of date 1 = | CALCULATE(SUM(Orders[Sales]), USERELATIONSHIP (Orders [Order Date], (‘As of Date 1′[Date]))) +0 |
| Sales as of date 2 = | CALCULATE(SUM(Orders[Sales]), USERELATIONSHIP (Orders [Order Date], (‘As of Date 2′[Date]))) +0 |
After creating these measures for the above metrics, we can now select dates individually and can see information until the dates we have chosen individually and the result is as follows:
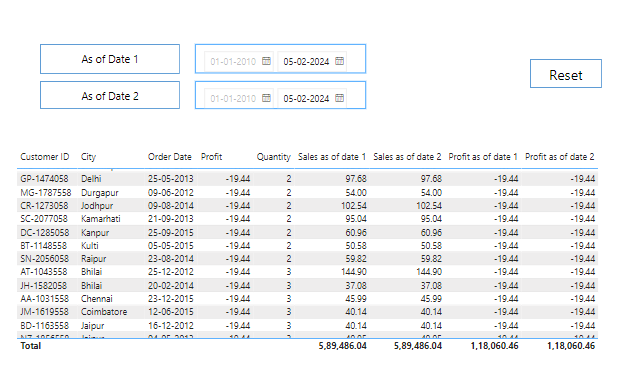
The above shows cumulative values for the dates specified from 2012 to 2016
Now, if I choose to select any different date, it is going to show us the data according to the selection.
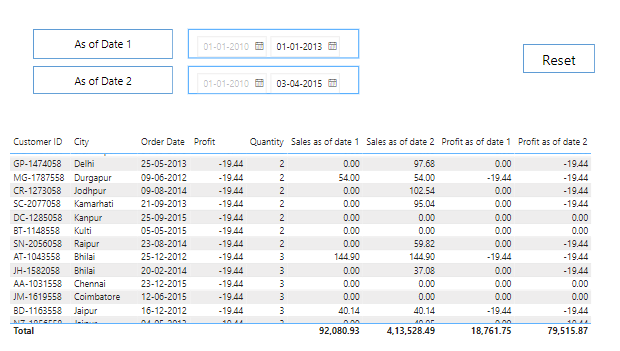
We can show the Sales and Profit by the dates selected and we can see the difference in the totals as well.
Conclusion:
The solution we have presented in this blog is typically used when users require data to be seen As-Of Date and a typical example of this is stocking broking where users need to view net profit and share quantity as-of date.
This blog was a collaboration between Venkateswara Rao Padavala, Senior Consultant and Vamsi Krishna Veluvolu, Senior Consultant in Data and Analytics Practice.
