Seamless Slicing – Uniting Default 2-Year Dates and Date Range Slicer in Power BI
Microsoft Power BI is an interactive data visualization software product focused on business intelligence. It empowers teams to collaborate better and gives users a way to visualize their data, leading to better comprehension and decision-making. At Apps Associates, we use Microsoft Power BI to help deliver Data and Analytics solutions to our customers. Along the way, we have amassed knowledge to help address some trickier features in Power BI. In this two-part series, we’ll cover a recent customer challenge and how we solved for it.
Challenge Overview:
The Apps team was presented with a challenge in a recent Power BI enhancement project:
Balancing the need for a default display of the last two years’ data upon report opening while allowing users the freedom to select alternative date ranges, all within a single slicer. Our customer did not want to incorporate a third-party slicer to a custom solution available from the marketplace, so our team needed a better solution.
Power BI Challenge: Relative date filters
Power BI offers relative filters in a date range. The relative date filter allows you to apply time-based filters to any date column in your data model.
To see this, go to the Power BI filters area, opt for advanced filtering options. Specifically, select Relative Date or Relative Time filtering mechanisms to define a dynamic date range. For instance, applying “is in the last 2 years” as a relative filter narrows down the data set to the specified timeframe.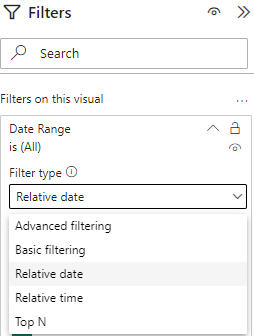
While the relative date filters can be useful, they also pose some challenges. We identified these limitations in the relative date filters for Power BI:
- The default Power BI slicer poses challenges when applying relative date filters, restricting selections solely to the specified range.
- This impedes the client’s vision of providing users with dynamic date range options beyond the default last two years.
An example to illustrate:
To help further visualize this, here is a real example from our recent project. When the user selects the Relative date filter and enters “is in the last 2 years”, the below image with highlighted dates is displayed. The data is only displayed between these two dates; selecting any other dates in the slicer will not be feasible as seen in the screenshot below.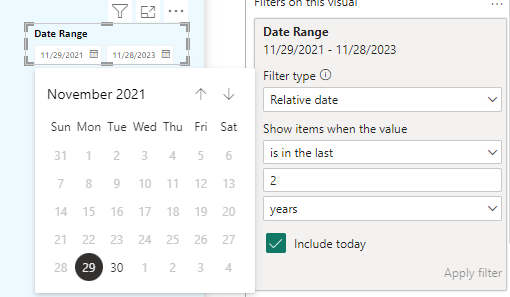
Since the filter only applies to the last two years, all other dates are disabled. Users can choose dates only from November 29, 2021, to November 28, 2023. December 2021 dates were enabled in the screenshot below because the month falls between November 29, 2021, and November 28, 2023.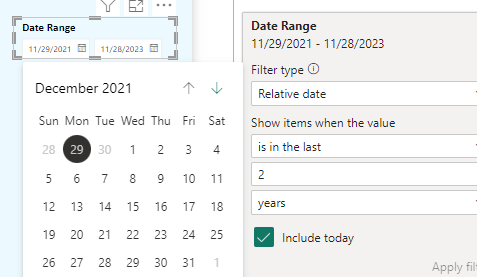
However, the client required that all date selections be made using the same slicer, with the default duration being two years. It is not feasible to obtain the solution using Microsoft Power BI’s default slicer, nor is it feasible to use two slicers with the same date column and carry out distinct actions.
To overcome this challenge either a third-party slicer or another calculated measure or column should be used with multiple slicers. For our purposes, it is necessary to use calculated measures or columns, since the client is not ready to accept custom or third-party visuals; the report’s performance will be poor if third party visuals are used.
To seamlessly satisfy the client’s requirements and improve the user experience, a sophisticated solution was developed leveraging Data Analysis Expressions (DAX) and a calculated column.
Proposed Solution 1:
Dynamic Calculated Column:
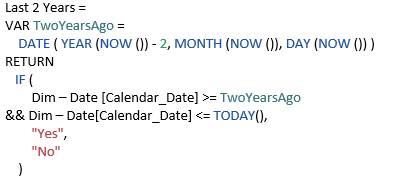
We introduced a calculated column that will always contain the dates from the previous two years based on the date columns used in Date Range Slicer. The DAX logic for the last two years’ dates is shown below:
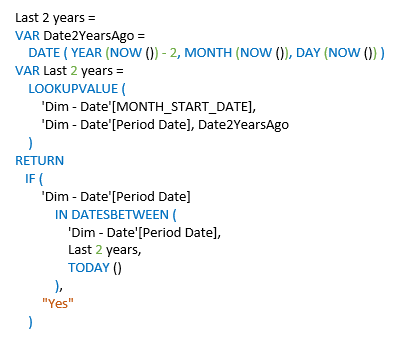
- This calculated column serves as a dynamic indicator for whether each date is part of the default last 2 years’ range.
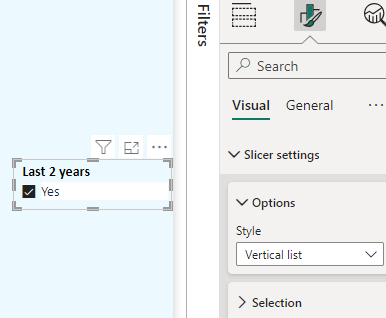
- Choose the slicer visual option, then drop the column with the above DAX into the slicer. In the slicer formatting, choose vertical list. “Yes” is the only value displayed in the list since, according to the reasoning above, there is only one value populated.
Intelligent Slicer Behavior:
-
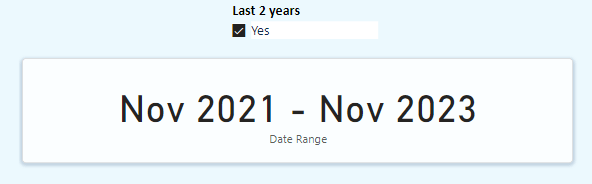
When users select “Yes” in the slicer:
- The report dynamically adjusts to display data from the last 2 years based on the calculated column.
-
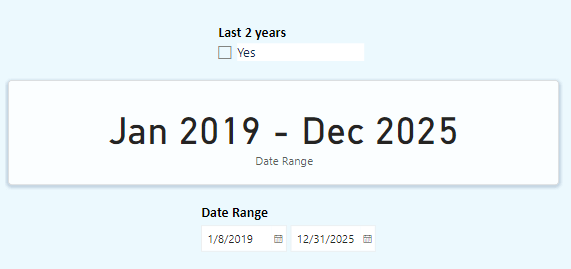
When users deselect “Yes”:
- The report seamlessly transitions to respecting the date range selected in the Date Range slicer, ensuring users have the flexibility to explore other date ranges.
Optimized User Workflow:
Before choosing or checking the last two years’ slicer, it is advised to clear the Date Range Slicer. Because the Last two years slicer is disabled if any of the dates in the Date Range slicer are older than two years.
Proposed Solution 2:
Dynamic Calculated Column:
- As in solution 1, here also introduced a calculated column that will always contain the dates from the previous two years, based on the date columns used in Date Range Slicer. The DAX logic for the last two years’ dates is shown below.
This solution will also have two default power bi-slicers, just like in solution 1. One slicer will display a Custom Date Range, while the other will display the last two years’ dates and offer Yes or No as selection options.
Advanced Grouping of Slicers:
The most important and magical step falls here, the two slicers are integrated to create a group in sync slicers. This grouping is very different from grouping of visuals. The procedure for grouping the slicers is as follows.
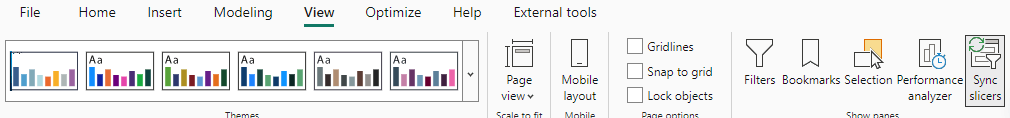
Navigate to View Menu -> Select Sync Slicers
Select Date Range Slicer, expand the Advanced options in the Sync Slicers pane, and enter a group name (Ex: Date Range Group) as shown in the below screenshot.
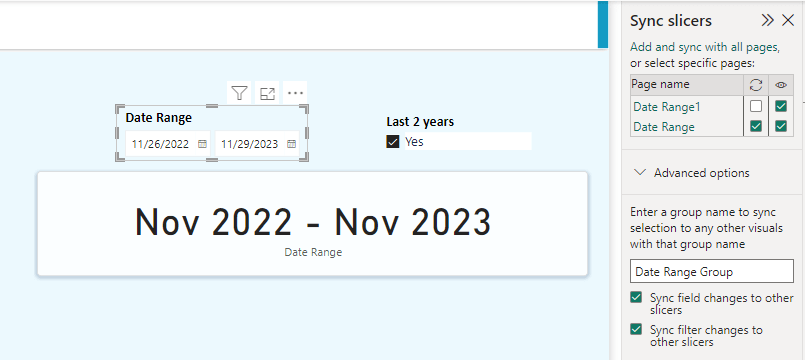
Now select the slicer Last 2 years and in the Sync Slicers pane, expand Advanced options, and enter the group name. This name must match the group name above (Ex: Date Range Group), if the name varies, the slicers cannot be grouped.
Conceal Last 2 Years Slicer:
- To achieve the dates for the Last 2 years, select “Yes” in the slicer. Hide this slicer since it is configured to retrieve dates for the last 2 years.
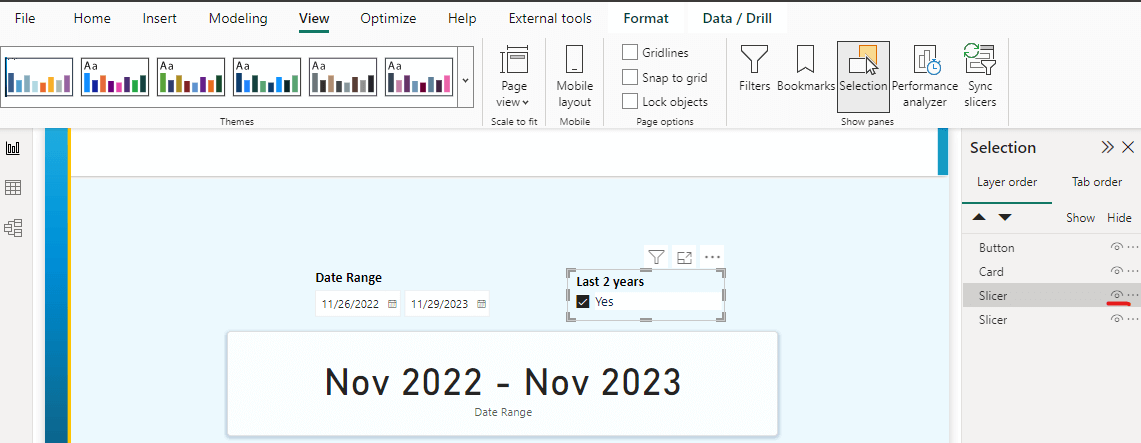
- The procedure to hide the slicer is as follows, Navigate to View Menu -> Select Selection as shown in screenshot below.
- To hide the slicer, in the selection pane, select the slicer Last 2 Years and click the eye icon.
Power BI Service Experience:
- Power BI Service displays true functionality. The PBIX must be saved and published to a workspace in Power BI Service after hiding the Last Two Years slicer.
- The report’s dates are set to the last 2 years by default. If the user would prefer to have a different range, can enter desired dates in the date range slicer, and the visuals will be filtered according to the dates entered.
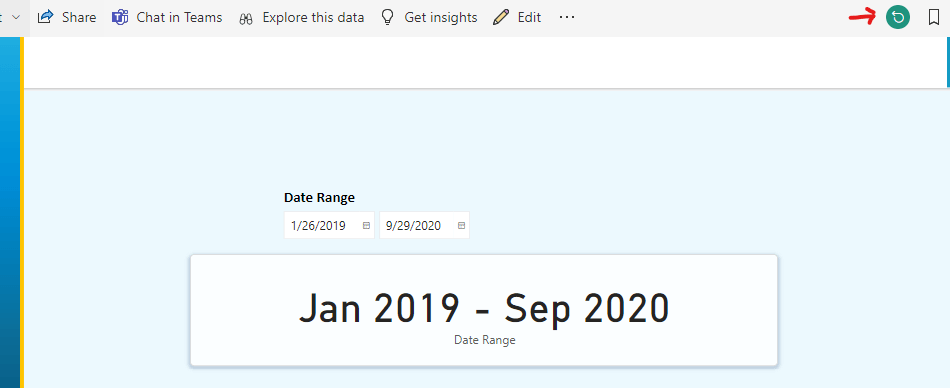
- If the user would rather view the dates from the last 2 years once more, a simple click on the reset filters option would get the last 2 years dates (reset filters becomes enabled once any changes were made in the slicers or filters available in the report page).
Note: When viewing reports in Power BI Service, Reset Filters option can assist in resetting all the applied filters.
Conclusion:
The comprehensive solutions leverage the power of DAX and intelligent slicer design to meet the client’s intricate requirements. The calculated column, integrated into the slicer, provides a seamless and user-friendly experience, allowing users to effortlessly switch between default and custom date ranges. The solution not only adheres to the client’s constraints but also enhances the overall functionality and flexibility of the Power BI report.
Apps Associates is a premier enterprise application and technology advisor, counseling and executing across every stage of the enterprise transformation journey—not just the destination. If you’re looking for a partner to assist with your data and analytics needs, including Microsoft Power BI, contact Apps today.
This blog was a collaboration between Venkateswara Rao Padavala, Senior Consultant and Jonathan Prasanth Dara, Senior Consultant in Data and Analytics Practice.